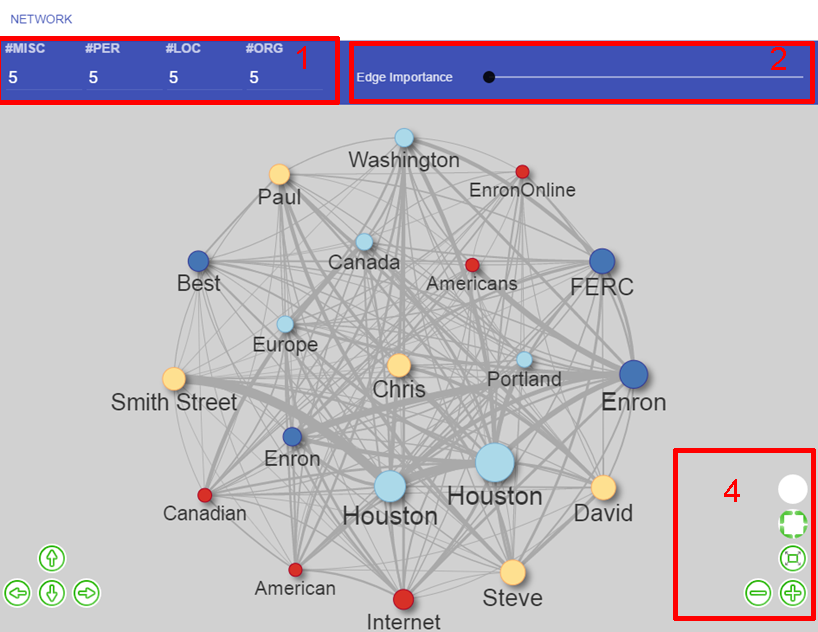
Change graph view settings
The user has several possibilities to adjust the appearance of the graph view
- Adjust the number of entities shown in the graph (1). The user specified number of entities (e.g. 5) with highest frequency per type are shown).
- The user can show/hide edges according to their importance (2). Importance means edge frequency (i.e., co-occurrence of entities in documents).
- The user can adjust the view:
- Show/hide legend (4)
- Show graph in full screen mode. Resume full screen mode by pressing “ESC” button.
- Reset focus of the view.
- Zoom in or out in the view.
Contact
Universität Hamburg
Language Technology Group
Prof. Dr. Chris Biemann
Vogt-Kölln-Straße 30
22527 Hamburg
![]() +49 40 42883 2386
+49 40 42883 2386
![]() biemann at informatik dot uni-hamburg dot deurg.de
biemann at informatik dot uni-hamburg dot deurg.de

