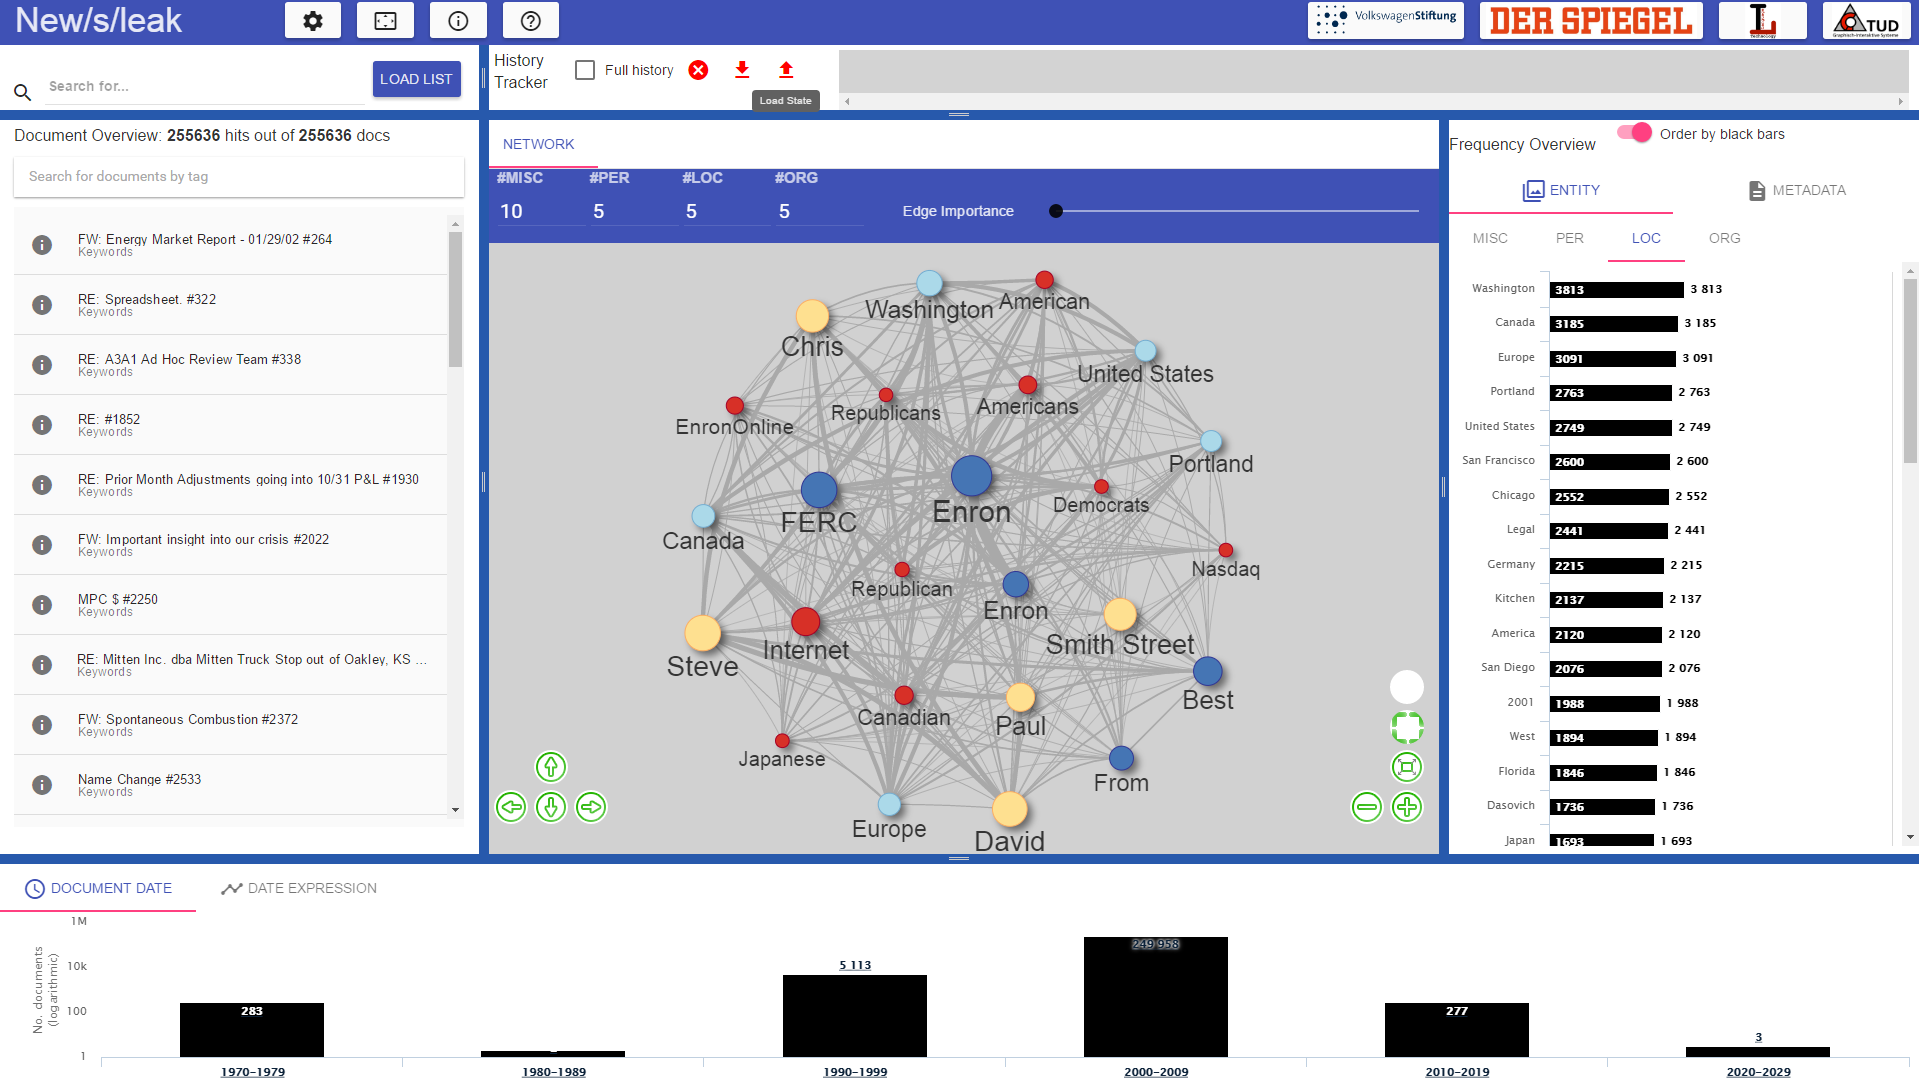
Frequency overview
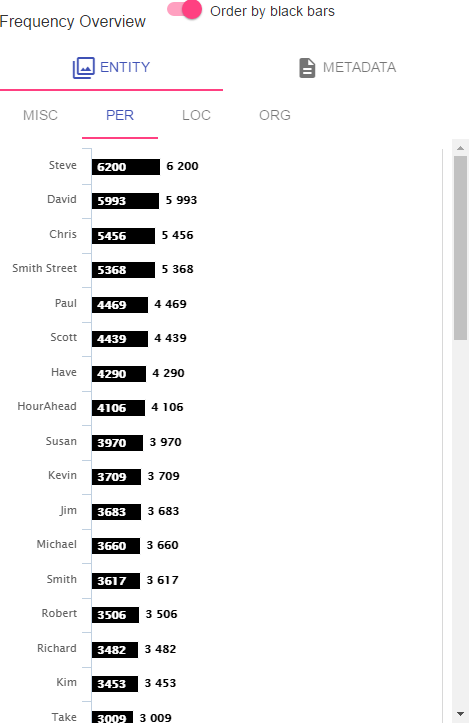
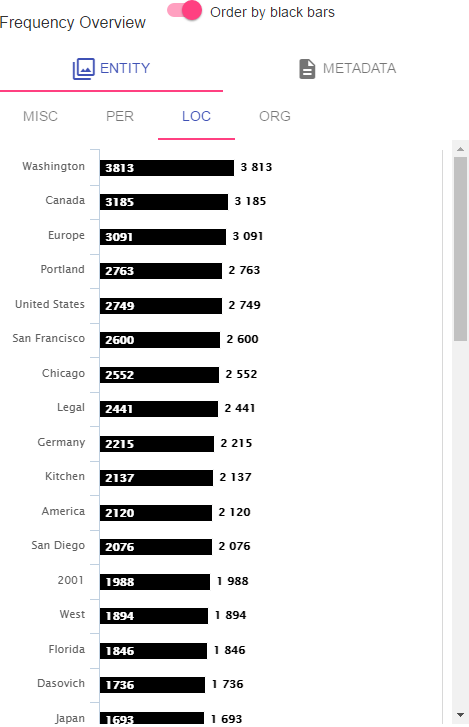
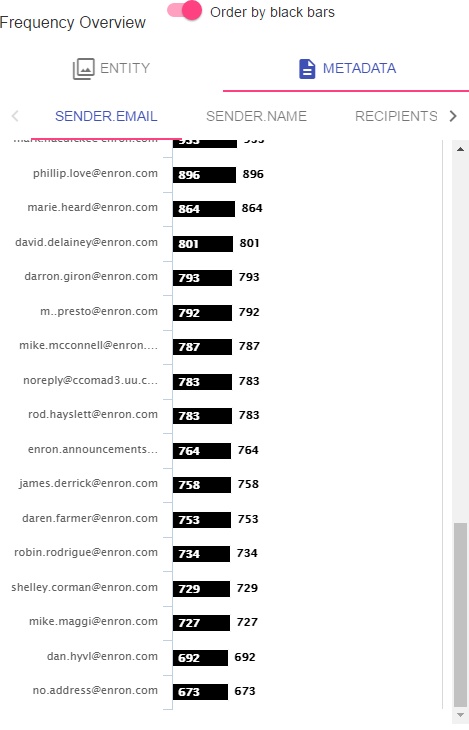
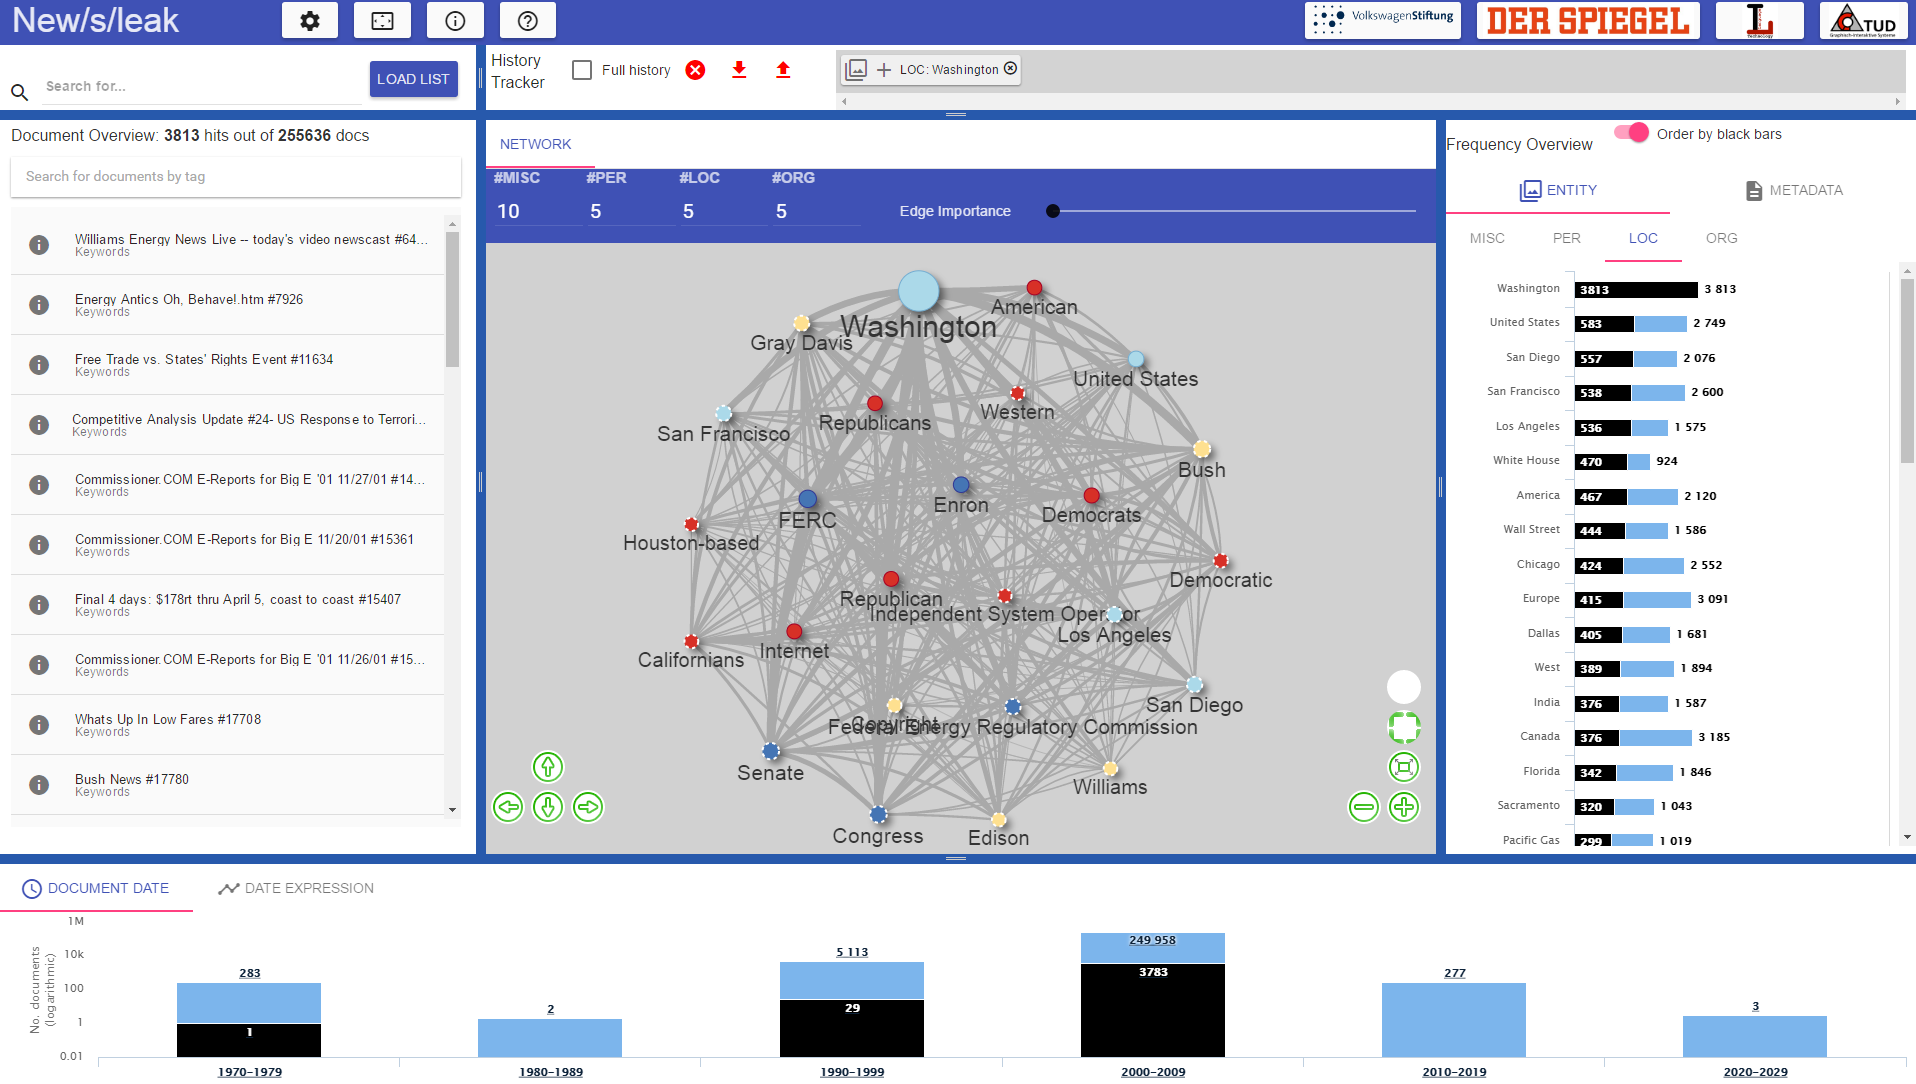
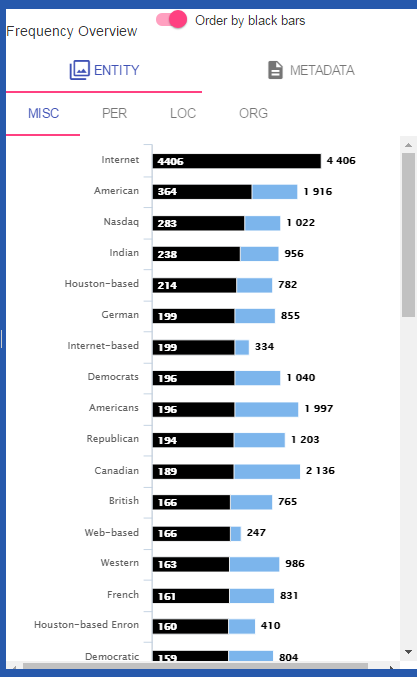
Frequency overview shows the number of documents for entities or metadata according to the current filter. The frequency overview shows the number of documents for the selected type of entities (persons, locations, organizations and mist) or the selected type of metadata (e.g. classification). The frequency of the top entities and metadata is shown as a bar chart. It uses logarithmic scale reflecting the distribution properties. The user can scroll to the bottom of the top-entity list. The frequency is adapted when applying a filter. (Click images to enlarge.)
Filter
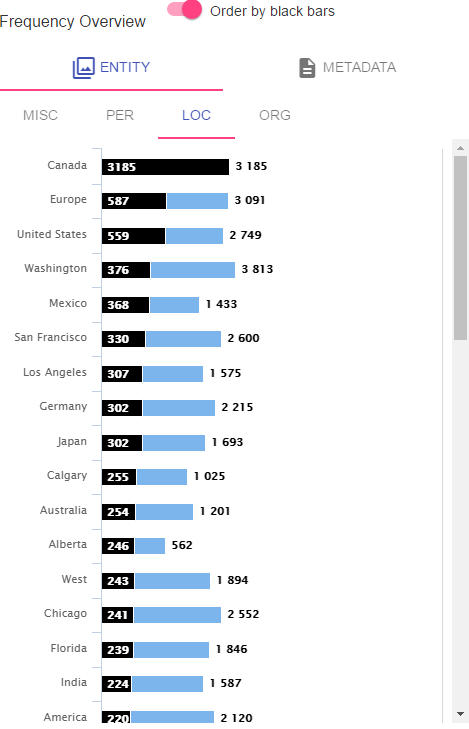
The frequency overview can be used as an entity or metadata filter. The user applies the filter by clicking on the bar. Afterwards all views (frequency view, document view, history view, graph view and timeline) are adapted according to the filter. The frequency overview shows the filter as follows: the blue bars show the frequency in the whole dataset and the black bars show the filtered frequency. The user can remove the filter in the history view.
Sorting
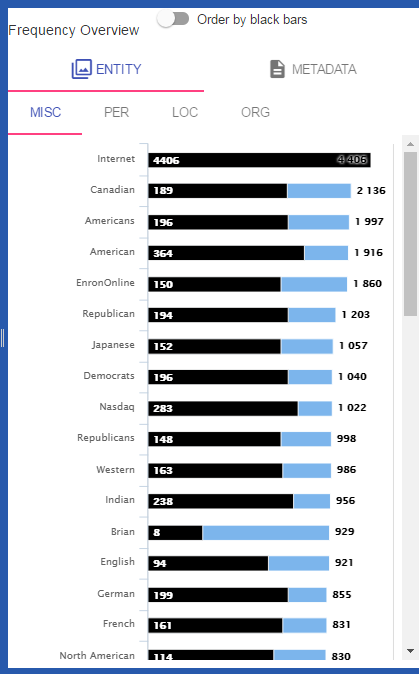
The bars in the frequency can be sorted according to the entity frequency in the whole dataset or according to the entity frequency in the filtered dataset. The user can choose which sorting to use by the red slider “Order by black bars” on the top of the frequency view. Sorting by the filtered dataset is the default option. (Click images to enlarge.)
Contact
Universität Hamburg
Language Technology Group
Prof. Dr. Chris Biemann
Vogt-Kölln-Straße 30
22527 Hamburg
![]() +49 40 42883 2386
+49 40 42883 2386
![]() biemann at informatik dot uni-hamburg dot deurg.de
biemann at informatik dot uni-hamburg dot deurg.de

