Changing the displaed entities and edges: Showing more/less entities and connections
Entity as a filter
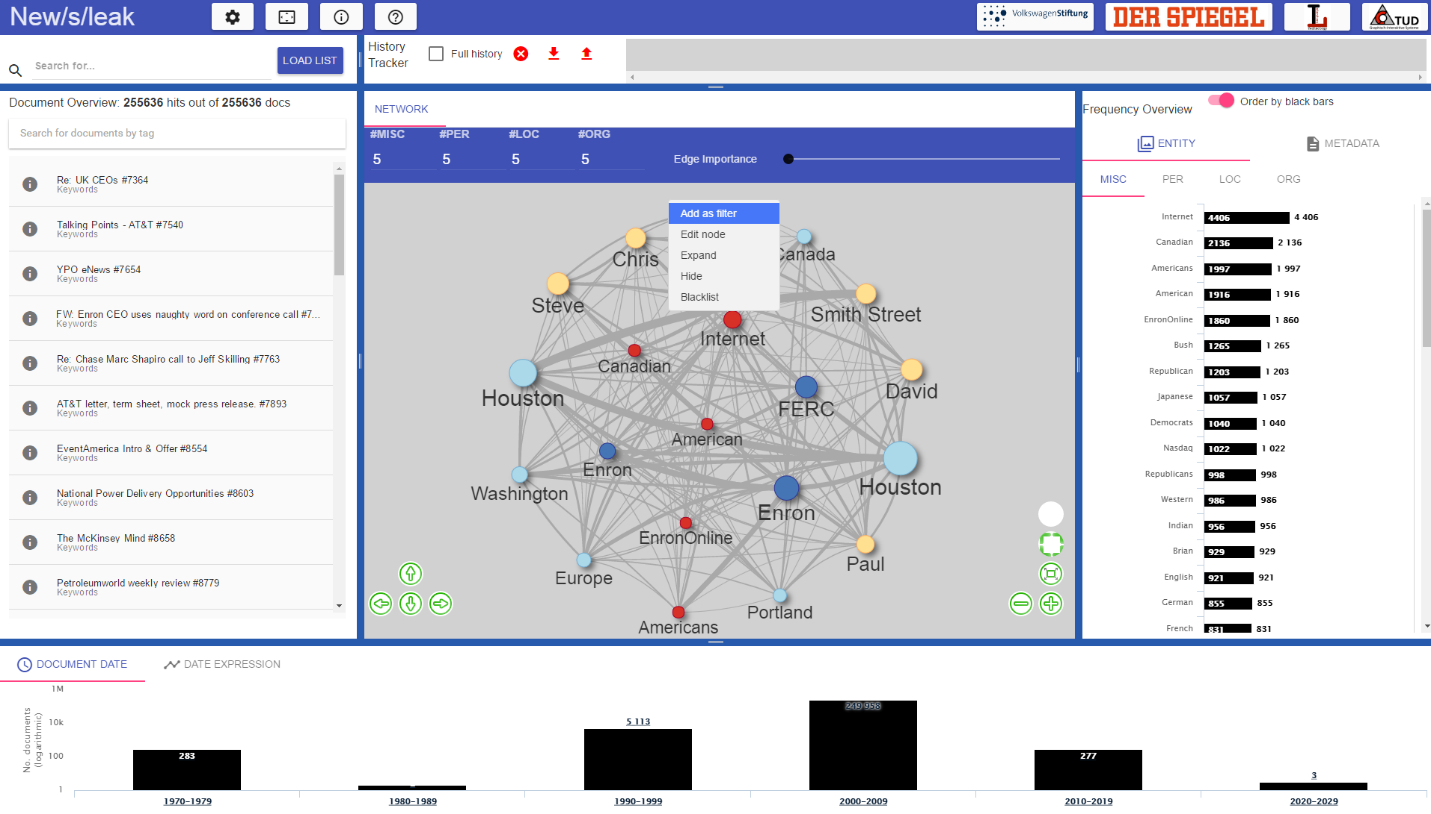
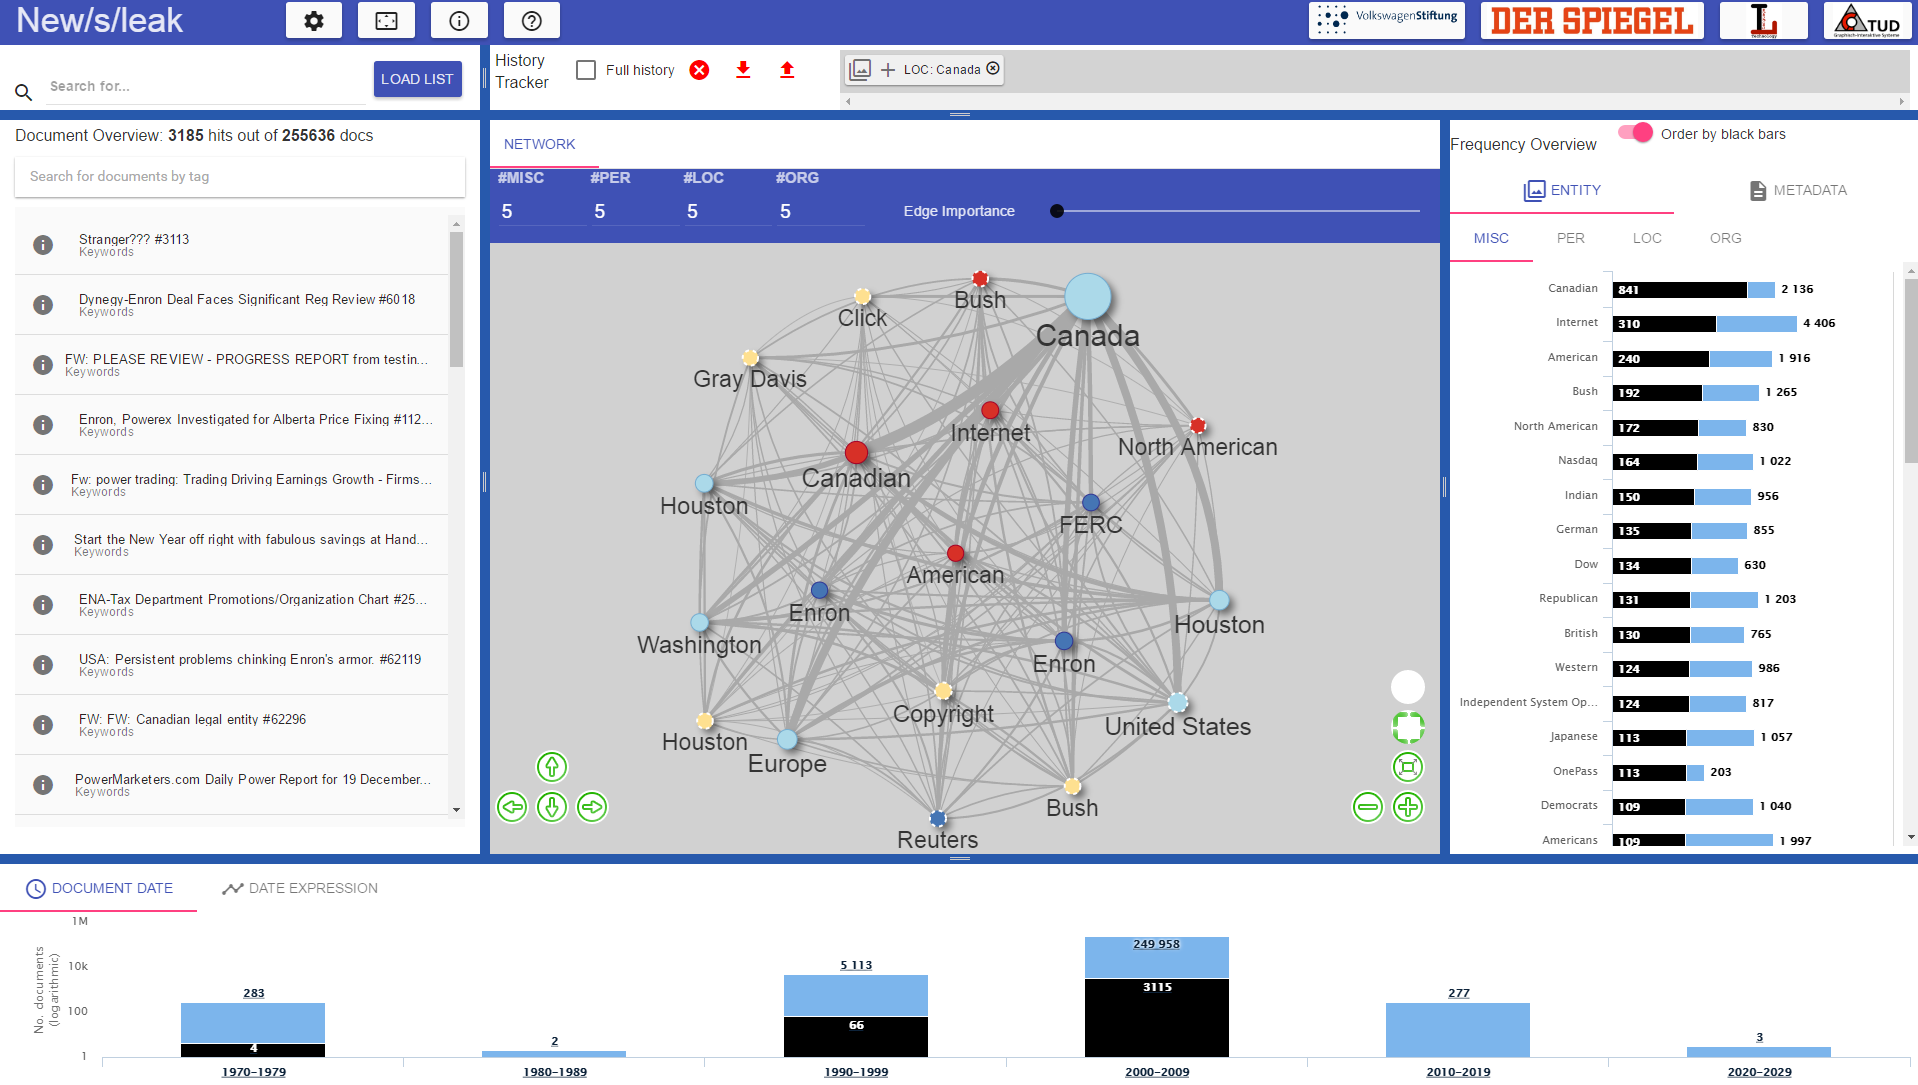
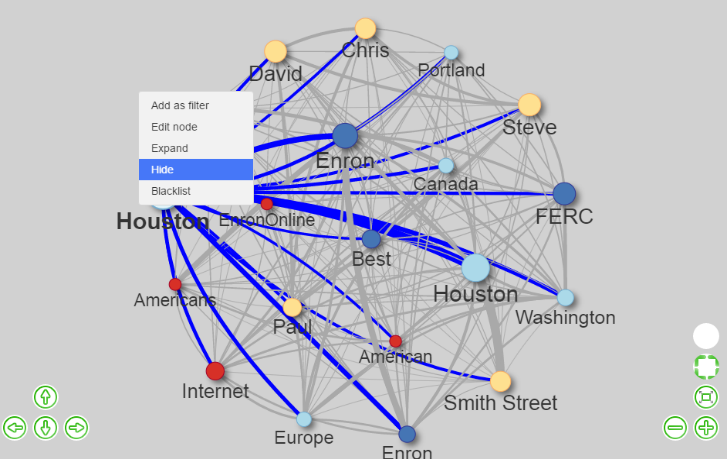
The user can filter the documents for an entity selected in the network. After clicking on “add as filter” in the context menu, the documents are filtered for this entity and the graph as well as other views (documents, timeline, frequency and history view) are updated according to the new filter. (Click images to enlarge.)
Expand entity – show more neighbors
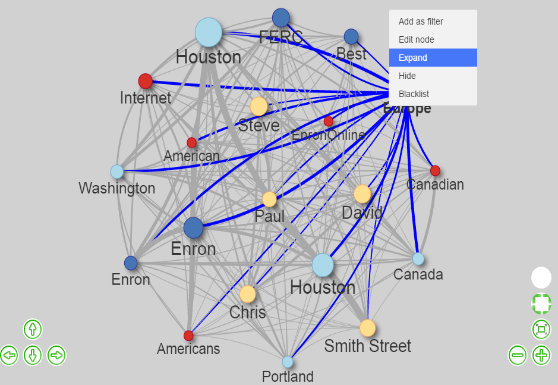
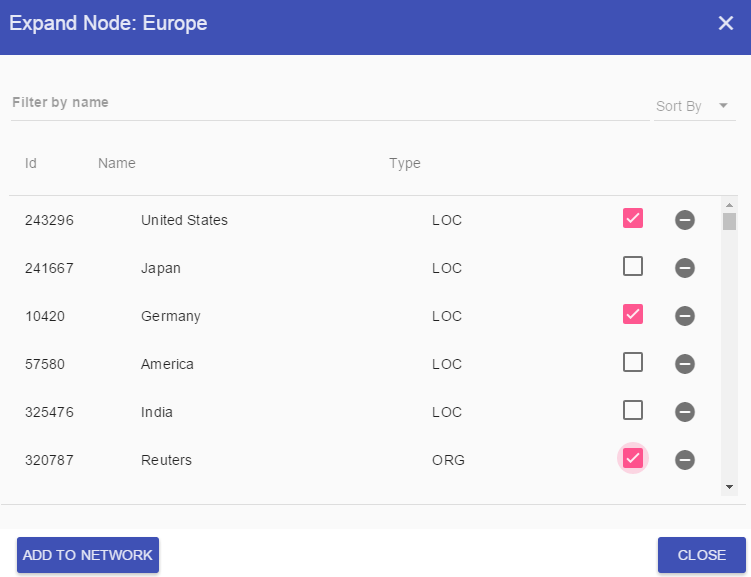
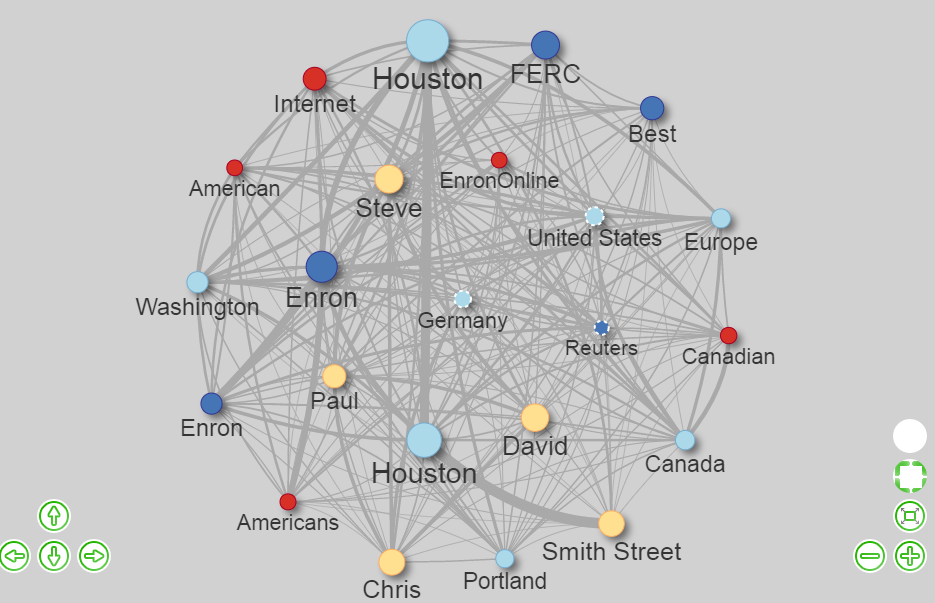
The user can explore the entities and their connections via expanding the graph along the neighbors of a selected entity (context menu -> Expand). Then the user can select which entities should be added to the network. The added nodes are highlighted with a white dotted border (see Europe on the right).
Hide entity
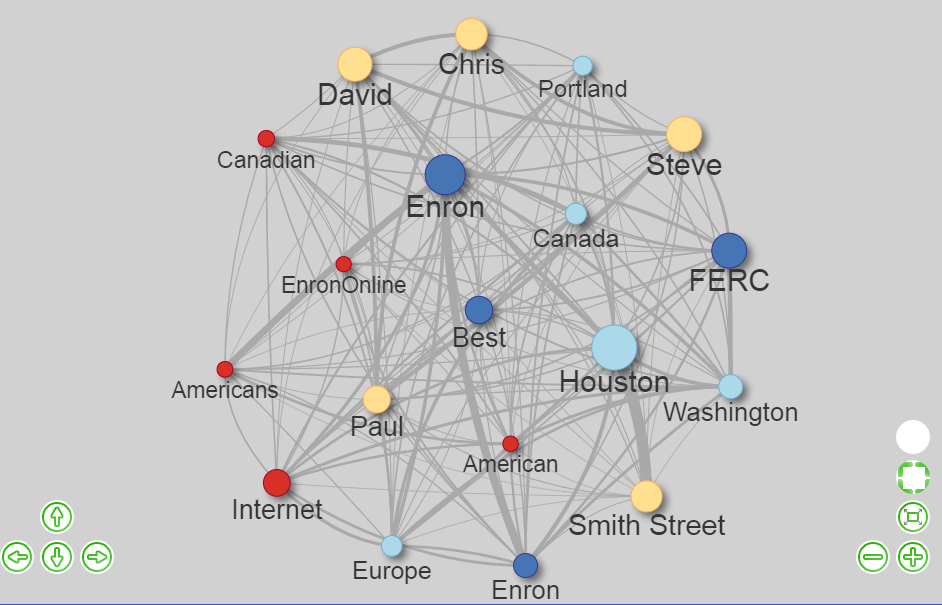
The user can hide entities from the view using the context menu of an entity. This entity is removed from the view, but not from the database.
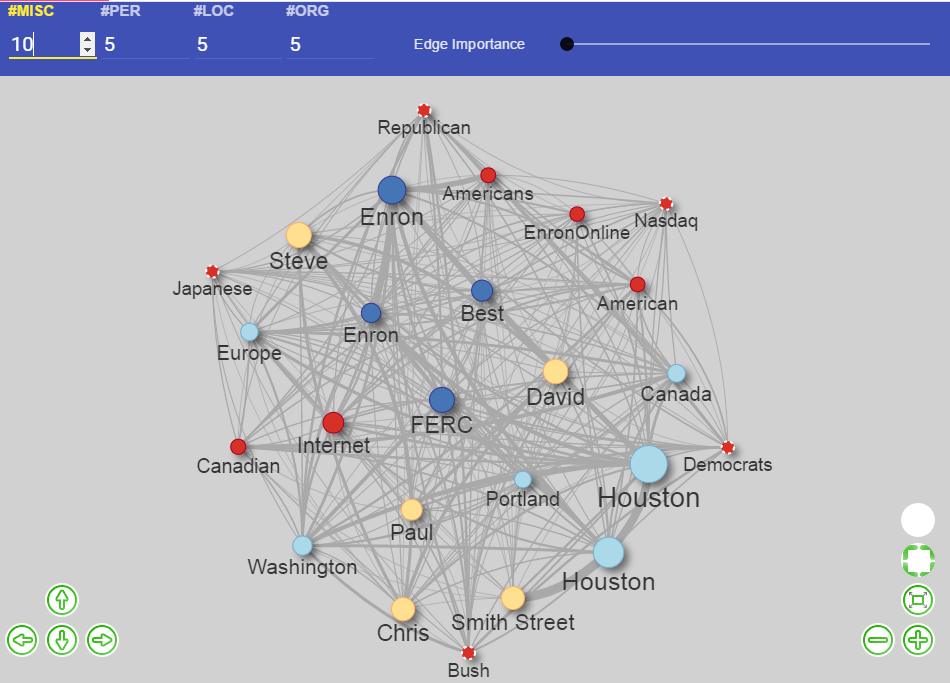
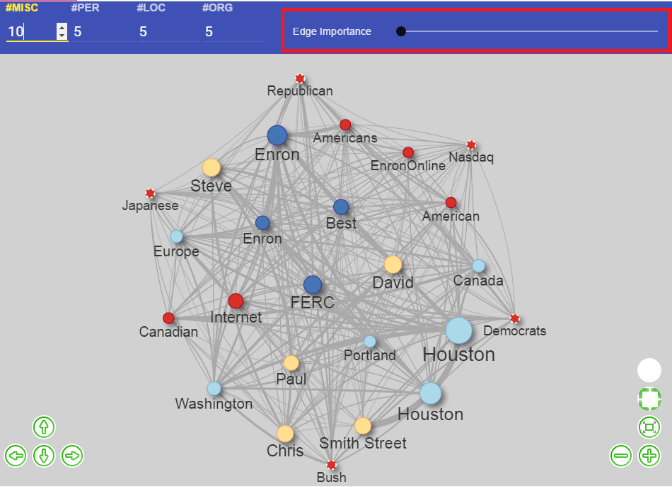
Show more high frequency entities by type
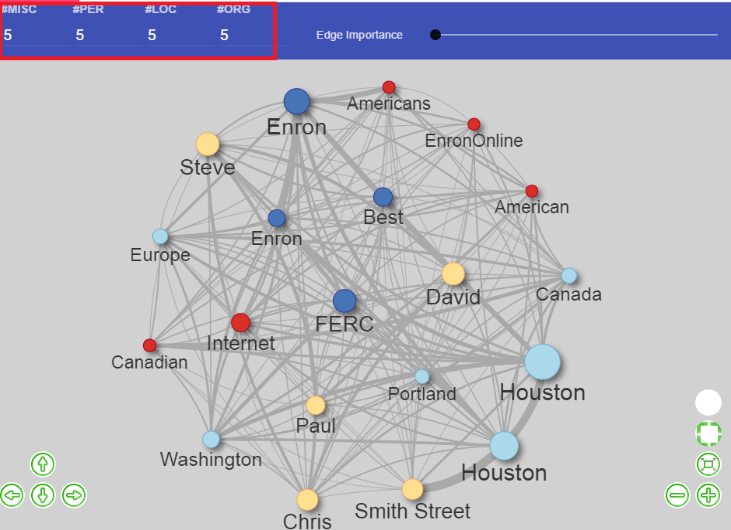
The graph view shows the entities with highest frequency by type (i.e., top X entities of type Y, such as top 5 persons). The user can set how many entities of which type should be shown using the menu on the top left (see red rectangle).
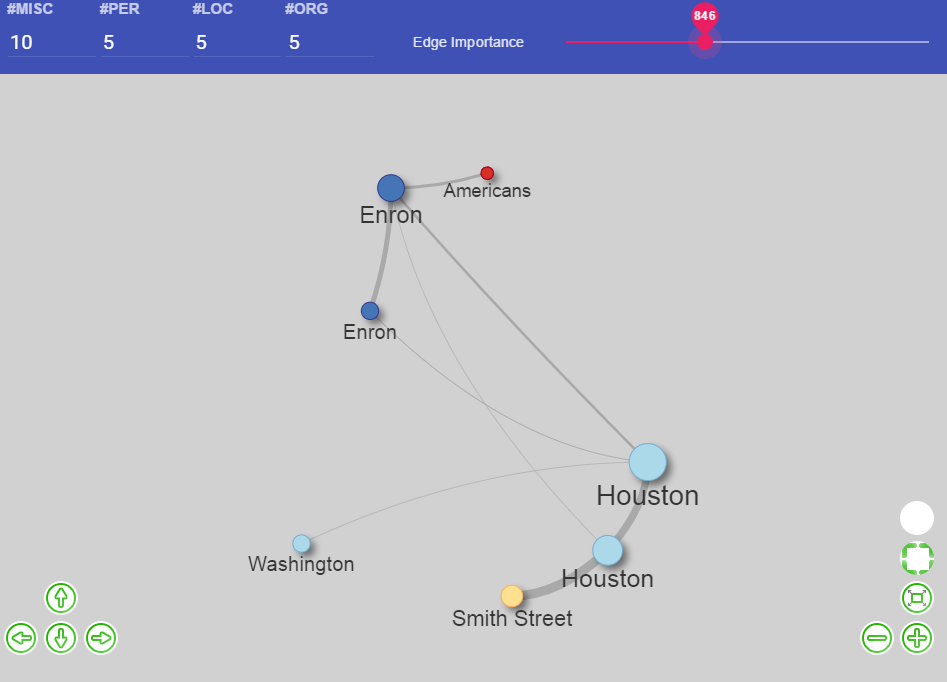
Hide edges
The user can set how many edges between the shown entities should be displayed. The slider on the top right (see red rectangle) sets how many edges are visible according to their frequency. Low values mean that many edges are shown, higher slider values hide more edges. Hiding edges also hides low-connected entities.
Contact
Universität Hamburg
Language Technology Group
Prof. Dr. Chris Biemann
Vogt-Kölln-Straße 30
22527 Hamburg
![]() +49 40 42883 2386
+49 40 42883 2386
![]() biemann at informatik dot uni-hamburg dot deurg.de
biemann at informatik dot uni-hamburg dot deurg.de

